It’s worth getting to grips with trading volumes if you want to better understand the crypto market.
A crypto-asset’s trading volume — how much of it is bought and sold within a given time frame — spins a complex yarn about its popularity.
These intervals can range from minutes, hours, months, or even years. Analysing trading volumes can reveal valuable insights into the inflows and outflows of money in DeFi, as well as the liquidity of specific assets.
When trading volumes spike, you’ll know something big is happening in the market — and it often isn’t good news.
For example, trading volumes for Terra’s UST stablecoin soared to all-time highs during its collapse in May 2022. Then when USDC broke its dollar peg in March 2023 amid the crypto banking meltdown, Ethereum decentralised exchanges recorded their highest ever trading volumes.
On the other hand, a slow and steady increase in trading volume can suggest increased use and adoption of a DeFi protocol or blockchain.
But be careful — often trading volumes turn out to be completely fraudulent. In an early application for a Bitcoin exchange-traded fund, software services provider Bitwise complained to the Securities and Exchange Commission that 95% of Bitcoin’s trading volume on CoinMarketCap was entirely made up. Things aren’t necessarily much better today.
This article will explain what crypto trading volumes are, how they are calculated and how to follow along using DefiLlama.
What are crypto trading volumes?
In the cryptocurrency market, trading volume refers to the value of all the trades of a particular asset within a specific amount of time.
Trading volume data is a mix of self-reported volume from cryptocurrency exchanges, much of it unverifiable, and on-chain volumes from decentralised finance protocols that are verifiable and traceable.
For example, the overall daily trading volume of Ether, the native currency of the Ethereum blockchain, is about $8.6 billion, according to crypto metrics site CoinMarketCap. This figure represents all the ETH that has been bought or sold on cryptocurrency exchanges in the past 24 hours.
It includes self-reported data from centralised exchanges and data scraped from DeFi protocols, like Uniswap, and excludes peer-to-peer transfers and over-the-counter trading.
In comparison, trading volume data on DefiLlama only draws from verifiable on-chain data, and looks at total trading volumes on specific blockchains or DeFi protocols, rather than for individual assets.
High trading volumes can signal strong buying pressure, where investors are eager to purchase an asset, or strong selling pressure, where investors are offloading their holdings.
Indeed, there’s a whole art dedicated to tracking changes in prices and volumes called technical analysis, where traders attempt to predict a cryptocurrency’s future price by deferring to patterns in price and volume charts.
Tracking trading volumes on DefiLlama
While sites like CoinMarketCap or CoinGecko focus on volumes of the entire crypto market, DefiLlama offers a comprehensive view of DeFi trading volumes.
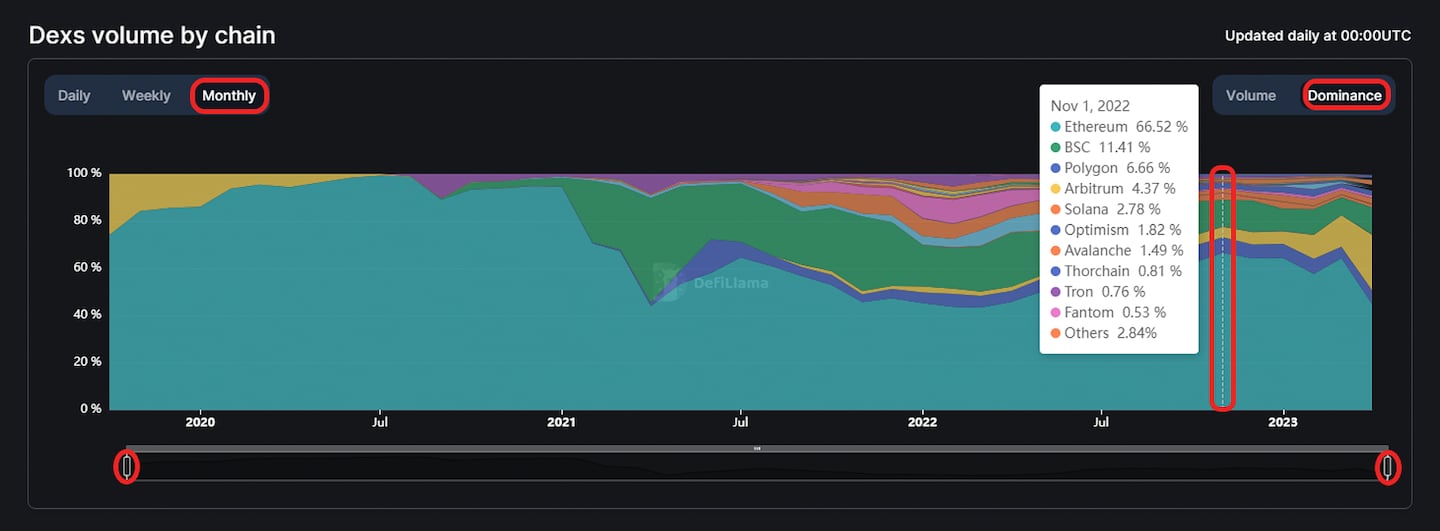
The Overview subsection lists trading volumes for decentralised exchanges, in order of 24-hour trading volume. Users can filter the data on daily, weekly, or monthly time frames, and across dozens of different blockchains.
The Chains subsection, on the other hand, provides data on the total trading volumes on different blockchains, such as Ethereum and BNB Chain. Users can find data showing the weekly change in trading volume and cumulative trading volume in addition to daily and weekly time frames.

For those interested in the non-fungible token market, DefiLlama also tracks trading volumes for popular NFT projects and marketplaces. It lists metrics, such as floor price, price change, volume, and collection supply, for various NFT collections. Additionally, DefiLlama ranks NFT marketplaces by volume, market share, and number of trades.
The Derivatives and Options subsections provide data on the trading volumes of various derivatives products, such as options and perpetual futures, across different platforms.
Users can filter the data by platform, blockchain, and time frame, allowing them to track the performance of different derivatives products and trading activity over time.
Are crypto trading volumes reliable?
Even on-chain data isn’t necessarily an accurate depiction of a protocol or asset’s trading volume. Fraudulent exchanges or traders can artificially inflate trading volumes to bump up the numbers, making an asset or protocol look more popular than it actually is. Garbage in, garbage out, as they say in programming.
Various accounting efforts have attempted to offset bogus trading volumes. NFT wash trading filters, like those offered on Nansen, CryptoSlam or on DefiLlama, try to remove inorganic activity and provide a more accurate picture of on-chain trading.
To highlight the extent of wash trading, DefiLlama’s NFT trading volume dashboard includes data showing the percentage of inorganic trades relative to organic trades over the past seven days.
Happy hunting!


