Ever since Ethereum began its transition to proof-of-stake in December 2020, investors have been able to stake Ether, the blockchain’s native currency, on the network.
After Ethereum’s Shapella upgrade in April, the network now derives its security solely from users staking Ether. In addition to helping secure Ethereum, staking also rewards those who do it with newly-minted Ether.
But there’s a crucial drawback. Staked Ether is locked for the duration it’s staked and cannot be normally used elsewhere in DeFi. To address this potential market inefficiency, a wave of DeFi protocols offering so-called liquid staking have sprung up.
Such liquid staking protocols stake depositors’ Ether for them and give out placeholder tokens, called liquid staking tokens, in return. They are also sometimes called liquid staking derivatives, though some note that the term “derivatives” comes with regulatory baggage.
These liquid staking tokens automatically accrue staking rewards and can be used elsewhere in DeFi. Popular uses for liquid staking tokens include providing liquidity on decentralised exchanges or as collateral for taking out DeFi loans.
On the other side of the equation, liquid staking protocols take a small cut of the rewards earned on users’ Ether deposits for the convenience they offer.
Liquid staking has swiftly become one of the most widespread methods of earning yield in DeFi. The biggest liquid staking protocol, Lido, has issued a whopping $14.5 billion worth of stETH — its native liquid staking token.
This makes Lido not only the biggest liquid staking protocol, but also the biggest protocol in all of DeFi.
And with over $18.4 billion of DeFi’s $38 billion TVL posted in liquid staking protocols, tracking them is essential to get a deeper understanding of both Ether staking and the DeFi market as a whole.
Tracking liquid staking
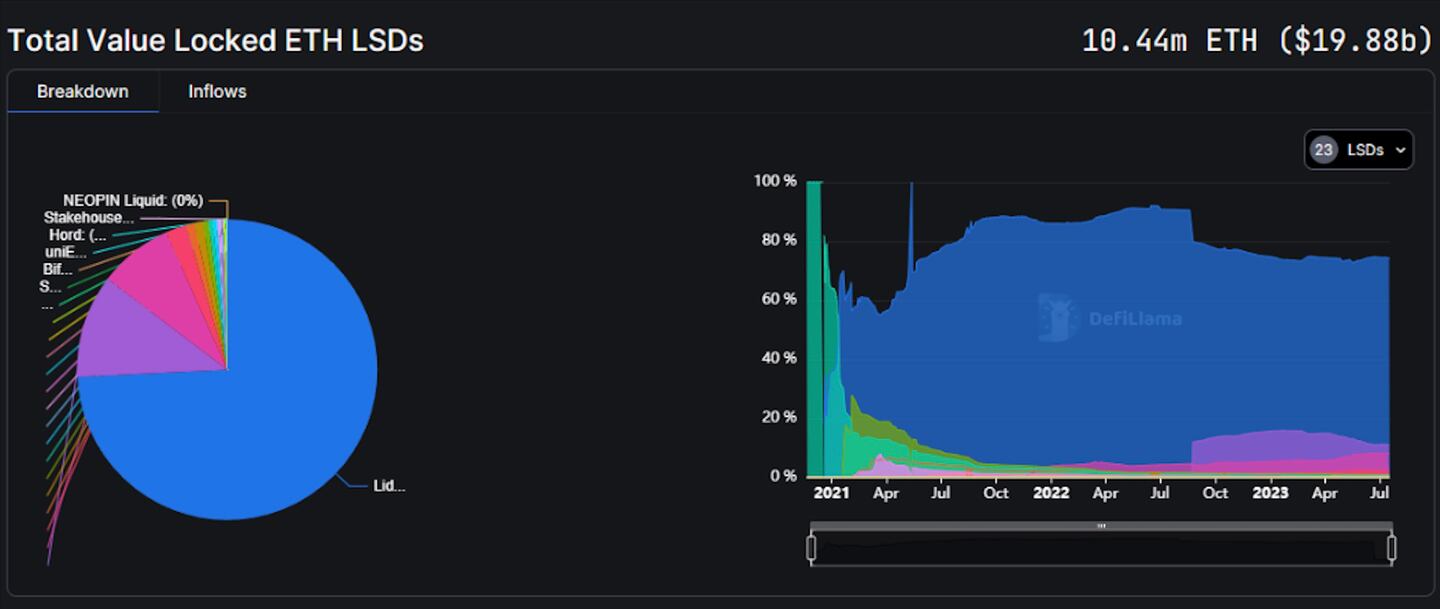
DefiLlama’s “ETH Liquid Staking” dashboard tracks the liquid staking market. It is comprised of two main charts:
- A pie chart that displays how much Ether is staked through each liquid staking protocol. It is useful to see which protocol issues the most staked Ether.
- An area chart that shows the relative market dominance of liquid staking protocols since Ether staking began in December 2020. It is useful for understanding the history of staked Ether allocation across the market.

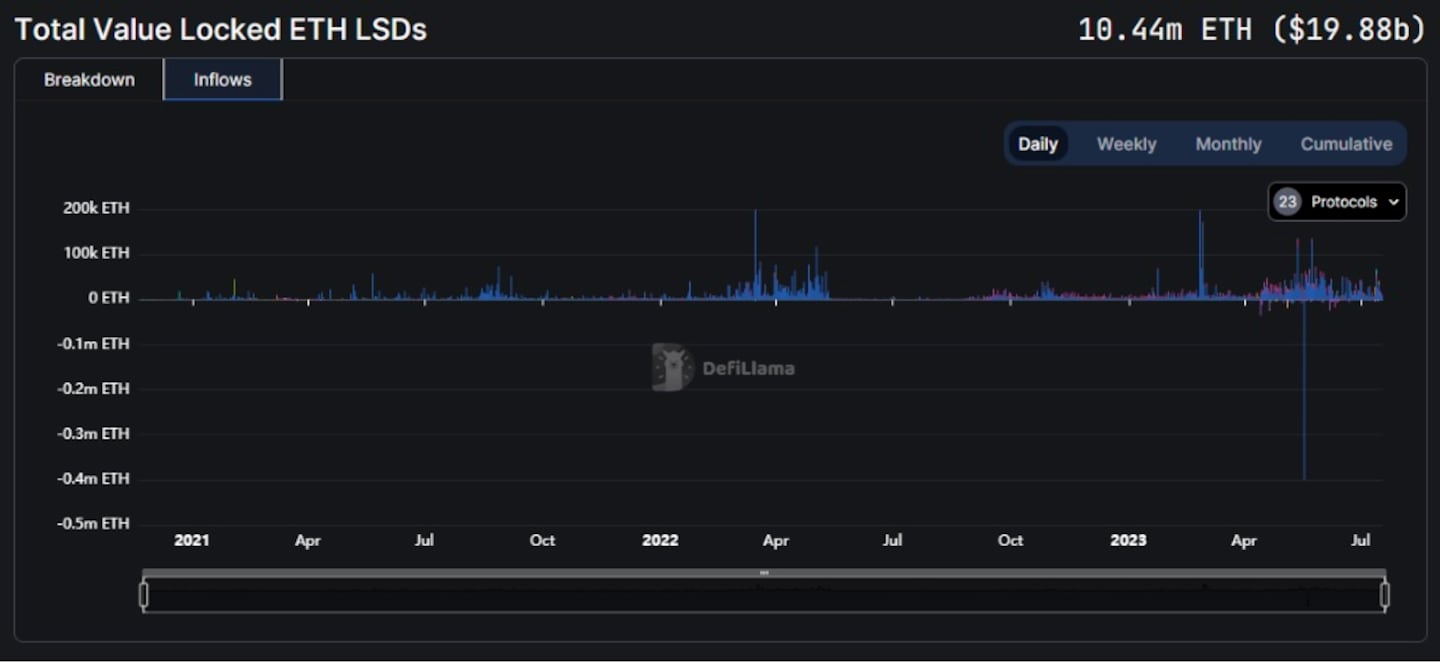
The dashboard also contains an “Inflows” tab that generates a bar graph of inflows and outflows from each liquid staking protocol.

Note the massive outflows on May 18, 2023. This was the day Ethereum completed its Shapella upgrade, which allowed stakers to withdraw Ether from the network’s staking contract for the first time.
At the time, many analysts worried the activating withdrawals would cause a mass exodus from Ether staking. While outflows did occur, the inflows in the subsequent months have dwarfed them in size.
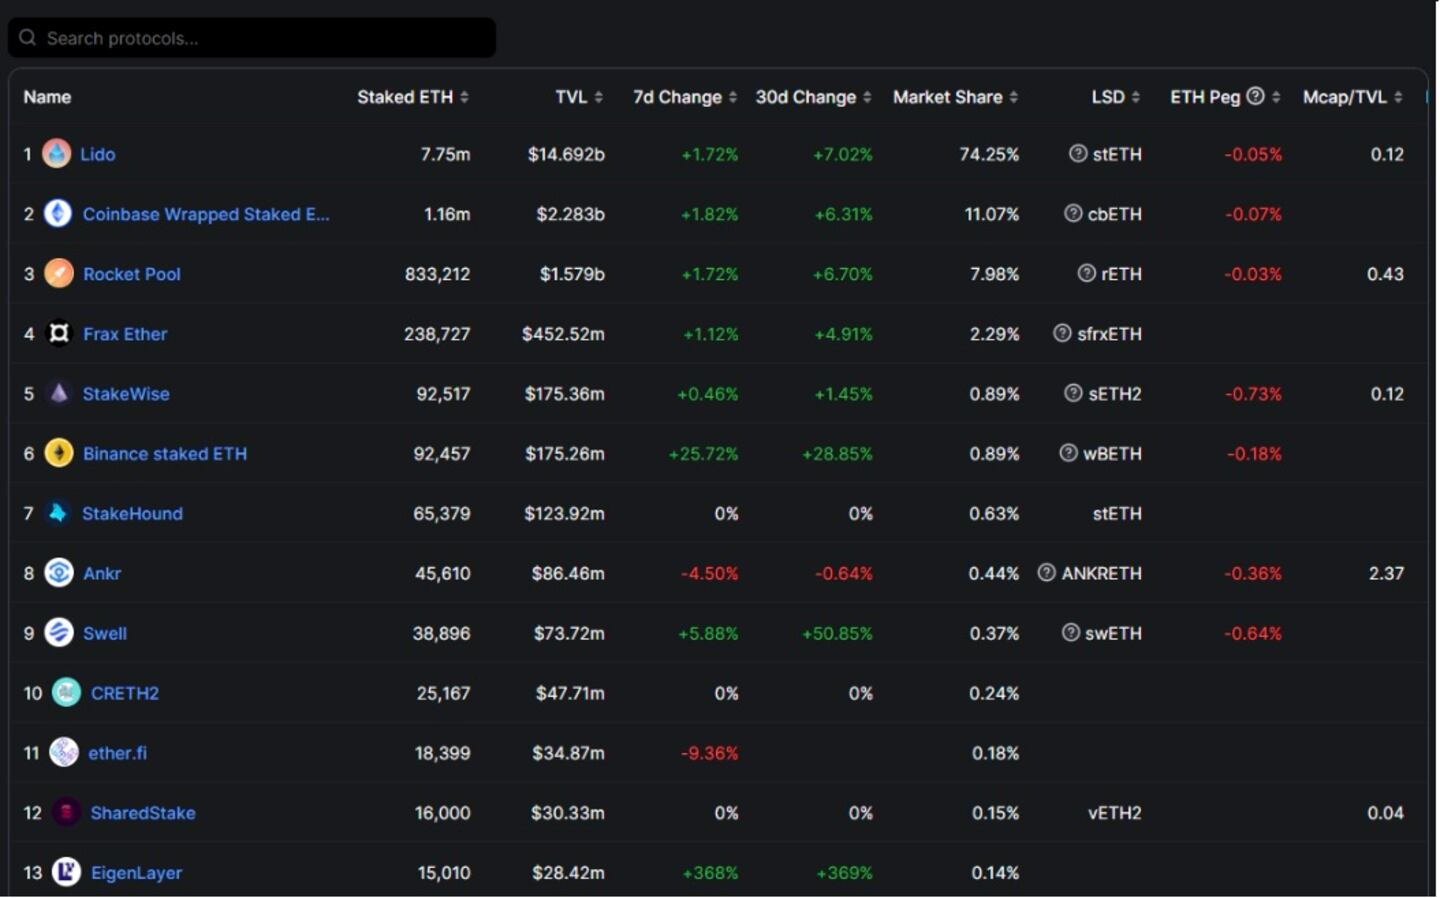
The dashboard also contains a list of the top Ether liquid staking protocols by TVL, or total value locked.

Metrics for each protocol include:
- Staked ETH: Shows the amount of Ether staked through the protocol.
- TVL: shows the protocol’s total value locked. This is basically a conversion of staked Ether into its USD value.
- 7d Change/30d Change: Tracks each protocol’s TVL change over seven-day and 30-day timeframes.
- LSD market share: Displays the percentage of the liquid staking market the protocol occupies.
- LSD: Lists the name of the protocol’s liquid staking token.For example, Lido’s native liquid staking token is stETH.
- ETH peg: Measures the difference between the liquid staking token’s price and the price of Ether. This disparity can result from arbitrage or liquidity conditions, among other reasons.
- Mcap/TVL: Shows the ratio between market capitalisation of a protocol’s governance token and its TVL, expressed as a decimal. This is a valuable metric for appraising a project’s upward potential, and is often likened to the P/E ratio of a traditional company.
- LSD APR: Shows how much yield a given liquid staking token earns annually. This metric can change based on the fees different liquid staking protocols charge, or how good their validators are at capturing profits from MEV.
Next steps
- Consider whether inflows and outflows of staked Ether correlate with wider market behaviour.
- Research why Lido is such a dominant presence in the liquid staking market. Who runs the protocol, and who are the major stakers? Does Lido pose problems for Ethereum’s decentralisation?


